
Business Overview Reports
Business Overview Reports provide a comprehensive summary of a company's key metrics and performance indicators.
Profit and Loss Report
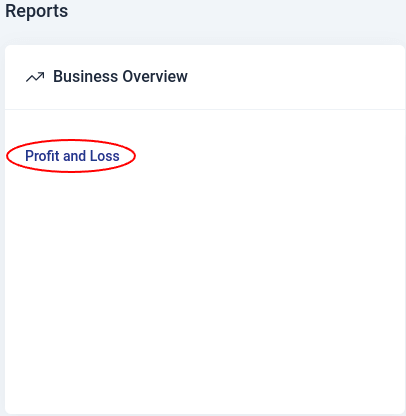
Go to Reports > Business Overview > Profit and Loss
What your business earned and spent over a period, read from the general ledger, the same source as the Balance Sheet and the Trial Balance, so the three agree with each other by construction.
The report lists your actual accounts rather than a handful of fixed totals, so you can see which income account earned what and which expense account it went to:
- Income
One line per income account, then Total income. Sales returns and discounts appear as their own accounts rather than being silently netted away.
- Cost of goods sold
The cost of what you actually sold in the period, taken from the cost layers each sale drew from, not from the item's price today. Gross profit is total income less this.
- Expenses
One line per expense account, then Total expenses. Cost of goods sold is not repeated here; it is already inside gross profit above.
- Net profit
Total income less cost of goods sold and expenses.
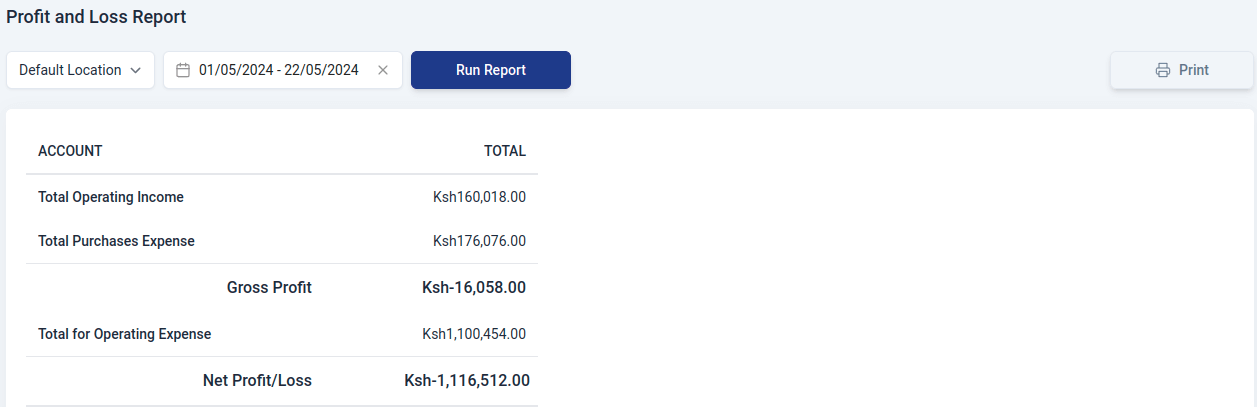
All the values are generated based on the location and time period that you’ve set.
Generating Report
To generate a customized report in the profit and loss section:
- Select the report type to go to the report view page.
- Choose the branch for the report.
- Set the time period using the date picker and click Select.
- Click Run Report to generate it.
- Use the print feature to print the report.
Reporting basis
The Profit and Loss can be run on either accrual or cash basis, and the report states which one produced it. See Cash and Accrual Basis for what the switch changes.
Balance Sheet
Your assets, liabilities and equity as at a date.
Retained earnings is computed from prior period results rather than carried forward by a year-end process, and current year earnings is shown separately so the two are legible rather than merged into one figure.
The report states whether it balances. Assets should always equal liabilities plus equity. If it ever reports otherwise, that is a posting problem worth surfacing rather than hiding.
Cash Flow Statement
Where cash actually came from and went, using the indirect method: it starts from accrual net profit, adds back non cash charges such as depreciation, adjusts for movement in receivables, payables and stock, and classifies the rest as operating, investing or financing.
The closing figure is checked against the actual movement in your cash and bank accounts over the period. A cash flow statement that does not reconcile to real cash is a defect to surface, not a number to present.
Filters
All three can be filtered by location and by reporting tag, so you can run a profit and loss for one branch, one department or one project.